Category Archives: Labor

Who is working at home during the pandemic?

In late March, Brent Neiman and I posted a paper addressing a straightforward and suddenly pressing question: How Many Jobs Can be Done at Home?

Our aim was to describe what is feasible. Looking at pre-2020 practices, one would not have observed many high-school teachers working from home, but the global pandemic changed that. We used information on job characteristics to estimate which occupations could be performed entirely at home. Of course, this supply-side trait is only one important ingredient when thinking about jobs during the crisis. Demand-side considerations, such as designating a job as “essential”, are clearly important too. Couriers and messengers cannot work from home, but this industry has seen robust employment growth in recent months.

Enough time has passed that we are now learning who has been working at home during the pandemic. In a recent Economics Observatory column (What has coronavirus taught us about working from home?) and the latest version of our paper, Brent and I discuss some of this evidence. The initial evidence suggests that our classification of occupations is quite sensible.

In the United States, Alexander Bick, Adam Blandin, and Karel Mertens have been conducting a Real-Time Population Survey, an online survey of adults designed to mimic the Current Population Survey. Last week, they released a paper called “Work from Home After the COVID-19 Outbreak“. They report that 35 percent of their US respondents worked entirely from home in May 2020. Their Figure 1 shows that the share of respondents in an industry working from home in May is highly correlated with our estimate of the feasible share for that industry.

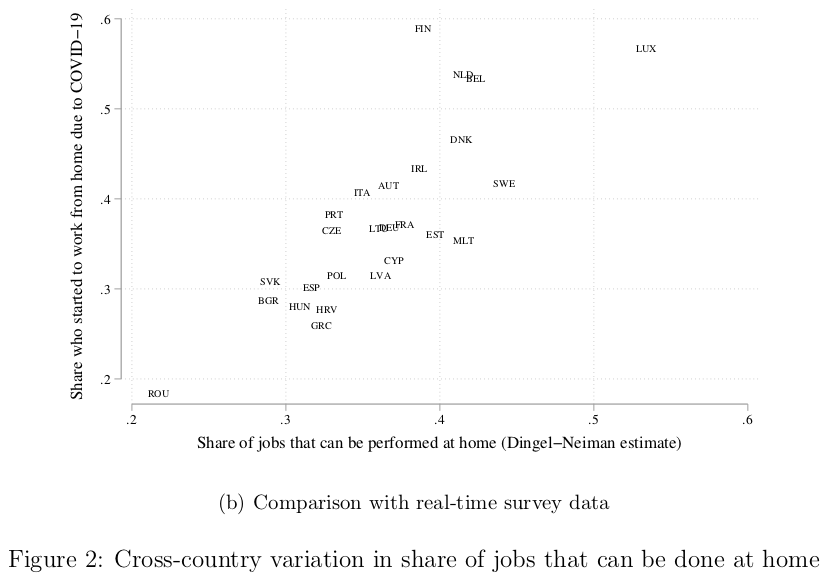
In Europe, the EU’s Eurofound launched an e-survey, Living, working and COVID-19, “to capture the most immediate changes during the pandemic and their impact.” Last month, they released first results on the impact of the pandemic on work and teleworking. As we report in our latest draft, there is a close correspondence between our country-level estimates of feasibility and what has occurred during the crisis.

Finally, while the latest update of the relevant paper hasn’t been posted online yet, in the video presentation below, Ed Glaeser reports that the industry-level variation in the share of jobs reported as being performed at home in a survey of small businesses is highly correlated with our industry-level feasible shares.

We classified the feasibility of working from home based on pre-pandemic conditions. Over time, I expect businesses to adapt their practices and leverage new tools to reallocate tasks and change the nature of jobs. A pressing question, which I briefly discussed at the end of a recent seminar presentation, is whether this temporary surge in remote work will have permanent consequences for the future of work.

In the short run, using pre-pandemic job characteristics to classify which jobs can be done at work has aligned well with who has actually been working at home during the pandemic.

Cross-country wage comparisons

On Saturday, I listened to Orley Ashenfelter’s AEA presidential address about cross-country wage comparisons. For a few years, Ashenfelter has been collecting data on “McWages“, so as to “to measure wages for virtually identical jobs, producing identical products in firms with identical technology.” In making these comparisons, he deflates the McDonald’s wage by the price of a Big Mac, thereby calculating the real producer wage.

Yesterday, the Atlantic’s Richard Florida had a post titled “Which Countries Pay Blue Collar Workers the Most?” It featured this BLS table:

Country Pay for Time Worked Total Hourly Compensation
1. Norway NA $57.53
2. Switzerland $34.29 $53.20
3. Belgium $24.01 $50.70
4. Denmark $34.78 $45.48
5. Sweden $25.05 $43.81
6. Germany $25.80 $43.76
7. Finland $22.35 $42.30
8. Austria $21.67 $41.07
9. Netherlands $23.49 $40.92
10. Australia $28.55 $40.60
11. France $21.06 $40.55
12. Ireland $26.29 $36.30
13. Canada $24.23 $35.67
14. United States $23.22 $34.74
15. Italy $18.96 $33.41
16. Japan $18.32 $31.99
17. United Kingdom $21.16 $29.44
18. Spain $14.53 $26.60
19. Greece $13.01 $22.19
20. New Zealand $17.29 $20.57

What does this table mean? Florida writes:

A quick look at the table above suggests that the level of compensation provided to manufacturing workers reflects a nation’s overall level of economic, social, and human development. And that is indeed the case, according to a simple statistical analysis by my colleague Charlotta Mellander.

Manufacturing compensation is closely related to productivity (measured as economic output per capita), global economic competitiveness and overall human development as well as my own Global Creativity Index. This is all in line with basic economics. And manufacturing compensation and wages are higher in nations with higher levels of education and where greater shares of the workforce are employed in knowledge, professional and creative jobs. In other words, manufacturing compensation and wages rise as nations become more post-industrial. Higher manufacturing compensation is also related to lower levels of inequality and higher levels of happiness.

Manufacturing workers are paid the best in the most advanced nations, places that boast advanced safety nets, generous benefit systems and high productivity. Post-industrial economies might not have the most manufacturing jobs, but their workers are the best paid. Instead of adopting a low-road strategy of trying to reduce manufacturing costs and wages in order to compete with China or other emerging economies, the U.S. would be better off with a high-road one, promoting policies that improve innovation, skills and productivity.

I think that we learn a lot about cross-country wage comparisons by thinking about what this table does not mean.

Does this table rank countries by the welfare of their blue-collar workers? No. Welfare depends on real consumer wages, not nominal wages, so a welfare comparison would necessitate deflating these nominal wages by local prices. For example, Switzerland is a notoriously expensive place to live; its price level is about 1.5 times that of the US. Those interpreting the table as saying that a US-to-Switzerland migration would raise their wages by 50% would be disappointed when they discovered the accompanying 50% price increase. So this table isn’t about workers’ welfare.

Does this table rank countries by their manufacturing TFP? No, for many (potential) reasons. For example, worker quality may differ considerably across countries. Suppose that all these countries are producing the same goods using the same technology, but different countries’ workers embody different numbers of efficiency units of labor. You’ll then observe substantial wage variation even if the unit cost of labor and manufacturing TFP are identical across countries.

Does this table rank countries by their labor productivity in manufacturing? It would if you believe we’re in a world of factor price equalization so that differences in wage rates must reflect differences in workers’ labor productivity. But are these workers making the same product using the same technology? Are enough factors of production sufficiently mobile to put us in the FPE set? Can large trade costs support differences in unit costs? And so forth.

[By the way, manufacturing employees aren’t all “blue-collar workers”. There is cross-country variation in the white-collar-blue-collar ratio of manufacturing, which will move the average hourly compensation measure.]

The BLS measure “hourly compensation costs in manufacturing” is a straightforward number, but cross-country wage comparisons are not a straightforward economic concept. Richard Florida suggests that we understand something about it by looking at its correlates. I would suggest that teaching students what this table does not mean may convey even more economic lessons.

One way to increase access to the US labor market

Tim Lee, writing for Ars Technica, describes a Silicon Valley startup aiming to facilitate the creation of more Silicon Valley startups by improving labor mobility:

Blueseed plans to buy a ship and turn it into a floating incubator anchored in international waters off the coast of California…

Immigration law makes it difficult for many would-be immigrants to get permission to work in the United States. For example, there’s an annual cap on the number of H1-B visas available for American employers to hire skilled immigrant workers. However, permission to travel to the United States for business or tourism is much easier to get.

Marty pointed to the B-1 business visa as a key part of his company’s strategy. With a B-1 visa, visitors can freely travel to the United States for meetings, conferences, and even training seminars. B-1 visas are relatively easy to get, and can be valid for as long as 10 years.
Blueseed plans to provide regular ferry service between the ship to the United States. While Blueseed residents would need to do their actual work—such as writing code—on the ship, Marty envisions them making regular trips to Silicon Valley to meet with clients, investors, and business partners…

Blueseed’s business model seems like a long shot. Buying, outfitting, staffing, and filling a 1,000-person ship seems like a tall order for even the most talented three-person team.

Growing visa costs for Indian IT firms

Mint reports that Indian IT companies are classifying workers servicing US clients as traveling for “knowledge transfer” in order to the circumvent the increased costs of H-1B and L-1 visas:

A report published on Monday by CLSA Asia-Pacific Markets showed that a firm’s ability to send workers to the US on visas directly affects its profitability. The report estimates that if a firm sends an Indian employee, its profit margin is 39.1%, while if it hires a local, it is 25.3% (considering that the utilization level is at 75%)…

[T]he US immigration framework lacks a visa category to allow firms to send workers to do “gainful” work on urgent, short-term assignments, according to Poorvi Chothani, founder of Mumbai-based corporate immigration law firm LawQuest.

“When visa caps have been met and companies need to send someone urgently, the inability to immediately engage them in the US is a huge impediment,” she said. According to her, in such cases “some companies may have made an ill-advised choice to send workers on business visas”.

Herman added that one of the top consular office’s concerns was a rise in the misuse of business visas, and “making sure we communicate adequately with businesses to make sure they know what they are allowed to do”. He claims that one of the reason most cited by employees of IT firms travelling to the US is “knowledge transfer” (which is permitted under the B1/B2 visas). “We refuse more of those types of cases these days because most of the time they cannot explain to us what that means,” he said. “So, that’s a very common issue—of going for knowledge transfer, when really what they’re doing is going to work on a project.”

The return to migrant experience

Studying Mexican laborers, Steffen Reinhold and Kevin Thom estimate a substantial return to US work experience, possibly as large as the return to Mexican education.

There is a growing literature assessing the effects of out-migration on the economies of migrant-sending countries. Research on this topic has been dominated by two main strands: one exploring the consequences of skilled migration (the “brain drain”), and one focusing on the determinants and effects of remittances. However, if migration is temporary and migrants eventually return home, there is another channel at work, which we call the skill-upgrading of return migrants. Migrants may be accumulating skills while working abroad that are transferable to the labor markets in their home country. If these individuals eventually move back home, they return as potentially more skilled and productive workers. This paper presents an empirical analysis of this phenomenon among migrants who return to Mexico after spending some time abroad in the United States…

We use data from the Mexican Migrant Project (MMP) and the Mexican Census to document the relationship between past U.S. migration experience and the labor market earnings of return migrants in Mexico. Our baseline specification suggests that there is a 2.7% return to a year of U.S. migration experience in the Mexican labor market. This exceeds the estimated return to age at every point in the life-cycle, and we cannot reject the null hypothesis that this is equal to the return to education…

We find evidence that much of the return to migration can be accounted for by occupation-specific job experience. The return to migration experience is largest for migrants who worked in occupations in the United States that match their current occupation in Mexico. Indeed, the return to a year of this kind of job-relevant migration experience is estimated to be a little less than 5.2% in the whole sample, and as high as 9.3% when restricting the sample to unskilled manufacturing workers. It is noteworthy that our basic estimate of the return to a year of job-relevant migration experience is almost twice as large as our estimate of the return to a year of education…

We also find a greater return to years of documented migration experience, but this seems to be related to the accumulation of relevant job experience. Individuals on documented migratory trips are more likely to find jobs that end up matching their occupation back in Mexico, and there also appears to be a greater return to relevant migration experience if it is accumulated with legal documents…

If job-relevant migration experience is highly rewarded in the Mexican labor market, policymakers interested in encouraging return migration and limiting visa overstaying might wish to design temporary worker programs with the skill-upgrading incentive in mind. For example, programs that allow workers to move between employers and otherwise place less restrictions on job search might allow workers to more easily find jobs similar to those available to them in Mexico.

The authors use a model and several controls to try to address concerns about self-selection amongst migrants and the endogeneity of trip duration; check out the full paper to judge for yourself.

Best practice in labor mobility

The World Bank’s Manjula Luthria on labor mobility for the poor (pdf):

The Pacific Islands and New Zealand program, known as the Recognised Seasonal Employer (RSE) scheme has been described by the International Labour Organization’s good practices database as a model for other destination countries. The New Zealand Department of Labour (2010) recently concluded that “Overall, the RSE policy has achieved what it set out to do.” The policy provides employers in the horticulture and viticulture industries with access to a reliable and stable workforce, with productivity gains starting to emerge as workers return for another season. The main concerns raised about temporary labor programs have been mitigated: the evaluation finds little displacement of New Zealand workers; almost all workers returned, with overstay rates of about 1 percent in the first season and less than 1 percent in the second; and concerns about worker exploitation have arisen in only a couple of isolated cases. A World Bank evaluation (McKenzie and Gibson 2010) also revealed that the RSE has also lived up to the policy goal of improving development in the Pacific Islands.

Based on this positive record, this note provides general lessons for policy makers who wish to institute similar TMP programs for the poor. These lessons could have wide portability due to the fact that the Pacific–New Zealand program is sizeable by international standards—already reaching one-third the size of Canada’s Seasonal Agricultural Worker Program, which is in its 44th year of operation and considered global best practice thus far. Three broad areas emerge as a priority for policy and operational focus: design, management, and capacity building.

State-level guest-worker programs

An interesting policy proposal described by the Economist:

Mr Shurtleff proposes an arrangement between Utah and individual Mexican states such as Nuevo Leon, in the north-east. Employers in Utah could request workers and the Mexican authorities would screen applicants. Utah would issue these Mexicans a guest-worker card similar to the driving permits it already gives illegal immigrants. It would separate “the work line from the immigration line,” says Mr Shurtleff.

He calls this the “Golden Spike initiative”, which is emotionally potent. It reminds Utahns of the transcontinental railroad, completed in Utah with a golden spike in 1869. What the Chinese and Irish labourers were then, Mr Shurtleff implies, Mexicans are today.

The irony in his proposal is that such a guest-worker programme would necessarily encroach upon a federal prerogative.